𝗔 𝗟𝗶𝘃𝗲 𝗠𝗮𝗽 𝗼𝗳 𝗪𝗵𝗮𝘁 𝗖𝗹𝗮𝘂𝗱𝗲 𝗖𝗼𝗱𝗲 𝗜𝘀 𝗗𝗼𝗶𝗻𝗴 You give Claude Code a task and the terminal fills with lines. Read, Grep, Bash, Edit, a subagent, another Bash. By the time you've scrolled back, it's done ten more things. lot-map turns that scroll into a picture. It's a small mod that opens 𝗮 𝗹𝗶𝘃𝗲 𝗺𝗮𝗽 𝗶𝗻 𝗮 𝗽𝗮𝗻𝗲 𝗯𝗲𝘀𝗶𝗱𝗲 𝘁𝗵𝗲 𝗰𝗵𝗮𝘁. In the middle is the agent. Around it are stations: You, Model, Memory, Files, Shell, Network, Browser, Agents, Skills and Hooks. Every time Claude does something, a pulse flies from the centre to the right station. • 𝗥𝗲𝗮𝗱𝗶𝗻𝗴 𝗼𝗿 𝗲𝗱𝗶𝘁𝗶𝗻𝗴 𝗰𝗼𝗱𝗲 lights up Files • 𝗥𝘂𝗻𝗻𝗶𝗻𝗴 𝗮 𝗰𝗼𝗺𝗺𝗮𝗻𝗱 lights up Shell • 𝗙𝗲𝘁𝗰𝗵𝗶𝗻𝗴 𝗮 𝗽𝗮𝗴𝗲 lights up Network • 𝗦𝘂𝗯𝗮𝗴𝗲𝗻𝘁𝘀 show up as small dots circling the Agents station It's not the first agent dashboard. Watching what a coding agent does has become its own category: • 𝗱𝗶𝘀𝗹𝗲𝗿'𝘀 𝗺𝘂𝗹𝘁𝗶-𝗮𝗴𝗲𝗻𝘁 𝗼𝗯𝘀𝗲𝗿𝘃𝗮𝗯𝗶𝗹𝗶𝘁𝘆: hooks send events to a Bun server and SQLite, viewed in a Vue dashboard. About 𝟭.𝟲𝗸 𝘀𝘁𝗮𝗿𝘀 • 𝗔𝗴𝗲𝗻𝘁 𝗙𝗹𝗼𝘄: a node graph of tool calls in VS Code or the browser, fed by a local relay. About 𝟭.𝟴𝗸 𝘀𝘁𝗮𝗿𝘀, Apache 2.0 • 𝗰𝗹𝗮𝘂𝗱𝗲-𝘁𝗿𝗮𝗰𝗲-𝗿𝗲𝗽𝗹𝗮𝘆 𝗮𝗻𝗱 𝗼𝘁𝗵𝗲𝗿𝘀: turn saved session logs into replayable traces All of these sit outside the agent. Events leave Claude Code, hit a local server, and show up in another window. 𝗹𝗼𝘁-𝗺𝗮𝗽 flips that. It's a Claude Code mod, so the map renders 𝗶𝗻 𝗮 𝗽𝗮𝗻𝗲 𝗿𝗶𝗴𝗵𝘁 𝗯𝗲𝘀𝗶𝗱𝗲 𝘁𝗵𝗲 𝗰𝗵𝗮𝘁, with no server, no network calls and no extra window. It's MIT, at v0.5.3, with 𝟱𝟮𝟭 𝘀𝘁𝗮𝗿𝘀 four days in. That's only possible because Claude Code now has mods, which let plugins draw their own panes and bands. I personally think that this is where agent tooling is heading. Dashboards that lived in separate apps will move into the agent's own interface, because that's where you're already looking. For users, it's a way to keep an eye on an agent without reading every line. For builders, it's an MIT-licensed TypeScript example of Claude Code's new mods feature. Some caveats. lot-map works only with Claude Code. It's 𝗳𝗼𝘂𝗿 𝗱𝗮𝘆𝘀 𝗼𝗹𝗱, at version 0.5.3. In a terminal it needs 𝗮𝘁 𝗹𝗲𝗮𝘀𝘁 𝟭𝟰𝟰 𝗰𝗼𝗹𝘂𝗺𝗻𝘀. It sees every tool call's full input, even though it keeps only the names. And installing from the repo follows its main branch, so "𝘢𝘯 𝘶𝘱𝘥𝘢𝘵𝘦 𝘣𝘳𝘪𝘯𝘨𝘴 𝘸𝘩𝘢𝘵𝘦𝘷𝘦𝘳 𝘪𝘴 𝘵𝘩𝘦𝘳𝘦." Link to repo👇 https://github.com/alexeyw/lot-map
A Live Map of What Claude Code Is Doing
lot-map is a Claude Code mod that renders a live map in a pane beside the chat, pulsing from the agent to stations like Files, Shell, Network and Agents on every tool call.
About this mod
The post introduces lot-map, a small MIT-licensed Claude Code mod (v0.5.3) that replaces scrolling through terminal output with a live picture of agent activity. In the centre sits the agent; around it are stations for You, Model, Memory, Files, Shell, Network, Browser, Agents, Skills and Hooks. Reading or editing code lights up Files, running a command lights up Shell, fetching a page lights up Network, and subagents appear as dots circling the Agents station. Unlike external observability dashboards that ship events to a local Bun/SQLite server or VS Code relay and render in another window, lot-map draws its map directly in a pane beside the chat with no server, no network calls and no extra window. Caveats noted: it works only with Claude Code, needs at least 144 terminal columns, sees every tool call's full input while retaining only names, and installing from the repo tracks the main branch. Repository: https://github.com/alexeyw/lot-map
Installation
Check the author's README for the marketplace and plugin name first. Commands may change as the repository evolves.
claude plugin marketplace add alexeyw/lot-map
claude plugin install lot-map@lot-map
Original text / README
𝗔 𝗟𝗶𝘃𝗲 𝗠𝗮𝗽 𝗼𝗳 𝗪𝗵𝗮𝘁 𝗖𝗹𝗮𝘂𝗱𝗲 𝗖𝗼𝗱𝗲 𝗜𝘀 𝗗𝗼𝗶𝗻𝗴 You give Claude Code a task and the terminal fills with lines. Read, Grep, Bash, Edit, a subagent, another Bash.
By the time you've scrolled back, it's done ten more things.
lot-map turns that scroll into a picture.
It's a small mod that opens 𝗮 𝗹𝗶𝘃𝗲 𝗺𝗮𝗽 𝗶𝗻 𝗮 𝗽𝗮𝗻𝗲 𝗯𝗲𝘀𝗶𝗱𝗲 𝘁𝗵𝗲 𝗰𝗵𝗮𝘁. In the middle is the agent. Around it are stations: You, Model, Memory, Files, Shell, Network, Browser, Agents, Skills and Hooks.
Every time Claude does something, a pulse flies from the centre to the right station.
• 𝗥𝗲𝗮𝗱𝗶𝗻𝗴 𝗼𝗿 𝗲𝗱𝗶𝘁𝗶𝗻𝗴 𝗰𝗼𝗱𝗲 lights up Files • 𝗥𝘂𝗻𝗻𝗶𝗻𝗴 𝗮 𝗰𝗼𝗺𝗺𝗮𝗻𝗱 lights up Shell • 𝗙𝗲𝘁𝗰𝗵𝗶𝗻𝗴 𝗮 𝗽𝗮𝗴𝗲 lights up Network • 𝗦𝘂𝗯𝗮𝗴𝗲𝗻𝘁𝘀 show up as small dots circling the Agents station
It's not the first agent dashboard.
Watching what a coding agent does has become its own category:
• 𝗱𝗶𝘀𝗹𝗲𝗿'𝘀 𝗺𝘂𝗹𝘁𝗶-𝗮𝗴𝗲𝗻𝘁 𝗼𝗯𝘀𝗲𝗿𝘃𝗮𝗯𝗶𝗹𝗶𝘁𝘆: hooks send events to a Bun server and SQLite, viewed in a Vue dashboard. About 𝟭.𝟲𝗸 𝘀𝘁𝗮𝗿𝘀 • 𝗔𝗴𝗲𝗻𝘁 𝗙𝗹𝗼𝘄: a node graph of tool calls in VS Code or the browser, fed by a local relay. About 𝟭.𝟴𝗸 𝘀𝘁𝗮𝗿𝘀, Apache 2.0 • 𝗰𝗹𝗮𝘂𝗱𝗲-𝘁𝗿𝗮𝗰𝗲-𝗿𝗲𝗽𝗹𝗮𝘆 𝗮𝗻𝗱 𝗼𝘁𝗵𝗲𝗿𝘀: turn saved session logs into replayable traces
All of these sit outside the agent. Events leave Claude Code, hit a local server, and show up in another window.
𝗹𝗼𝘁-𝗺𝗮𝗽 flips that. It's a Claude Code mod, so the map renders 𝗶𝗻 𝗮 𝗽𝗮𝗻𝗲 𝗿𝗶𝗴𝗵𝘁 𝗯𝗲𝘀𝗶𝗱𝗲 𝘁𝗵𝗲 𝗰𝗵𝗮𝘁, with no server, no network calls and no extra window.
It's MIT, at v0.5.3, with 𝟱𝟮𝟭 𝘀𝘁𝗮𝗿𝘀 four days in.
That's only possible because Claude Code now has mods, which let plugins draw their own panes and bands.
I personally think that this is where agent tooling is heading. Dashboards that lived in separate apps will move into the agent's own interface, because that's where you're already looking.
For users, it's a way to keep an eye on an agent without reading every line.
For builders, it's an MIT-licensed TypeScript example of Claude Code's new mods feature.
Some caveats. lot-map works only with Claude Code. It's 𝗳𝗼𝘂𝗿 𝗱𝗮𝘆𝘀 𝗼𝗹𝗱, at version 0.5.3. In a terminal it needs 𝗮𝘁 𝗹𝗲𝗮𝘀𝘁 𝟭𝟰𝟰 𝗰𝗼𝗹𝘂𝗺𝗻𝘀. It sees every tool call's full input, even though it keeps only the names. And installing from the repo follows its main branch, so "𝘢𝘯 𝘶𝘱𝘥𝘢𝘵𝘦 𝘣𝘳𝘪𝘯𝘨𝘴 𝘸𝘩𝘢𝘵𝘦𝘷𝘦𝘳 𝘪𝘴 𝘵𝘩𝘦𝘳𝘦."
Link to repo👇 https://github.com/alexeyw/lot-map
Get a badge
Is this your project? Add this badge to your README or website. It links back to this page.

Similar projects
A macOS Claude Code desktop mod that surfaces pending agent questions above the prompt, lets users answer with one click, queues decisions, and tracks session activity.
✳︎ I built a HUD for Claude Code: the question your agent is waiting on sits above the prompt, and one click answers it
└─ Make every conversation easier
I built a HUD for Claude Code: the question your agent is waiting on sits above the prompt, and one click answers it

A pixel-art progress bar with the Claude mascot and a side panel that turns your subagents into a crew of characters (developer, artist, researcher, tester, Codex...).

pixel-crew

A 260K-parameter TinyStories transformer running inside Claude Code as a mod, writing a short local story above the prompt seeded by the current tool, file and prompt words.
✳︎ storytime
└─ Make every conversation easier
storytime

A Claude Code plugin mod providing a /databricks-pane that presents Databricks workspace, Unity Catalog, compute, jobs, pipelines, apps and dashboards as a tree following the databricks CLI, with live highlights, profile switching, and CLI argument copy.
databricks-cli

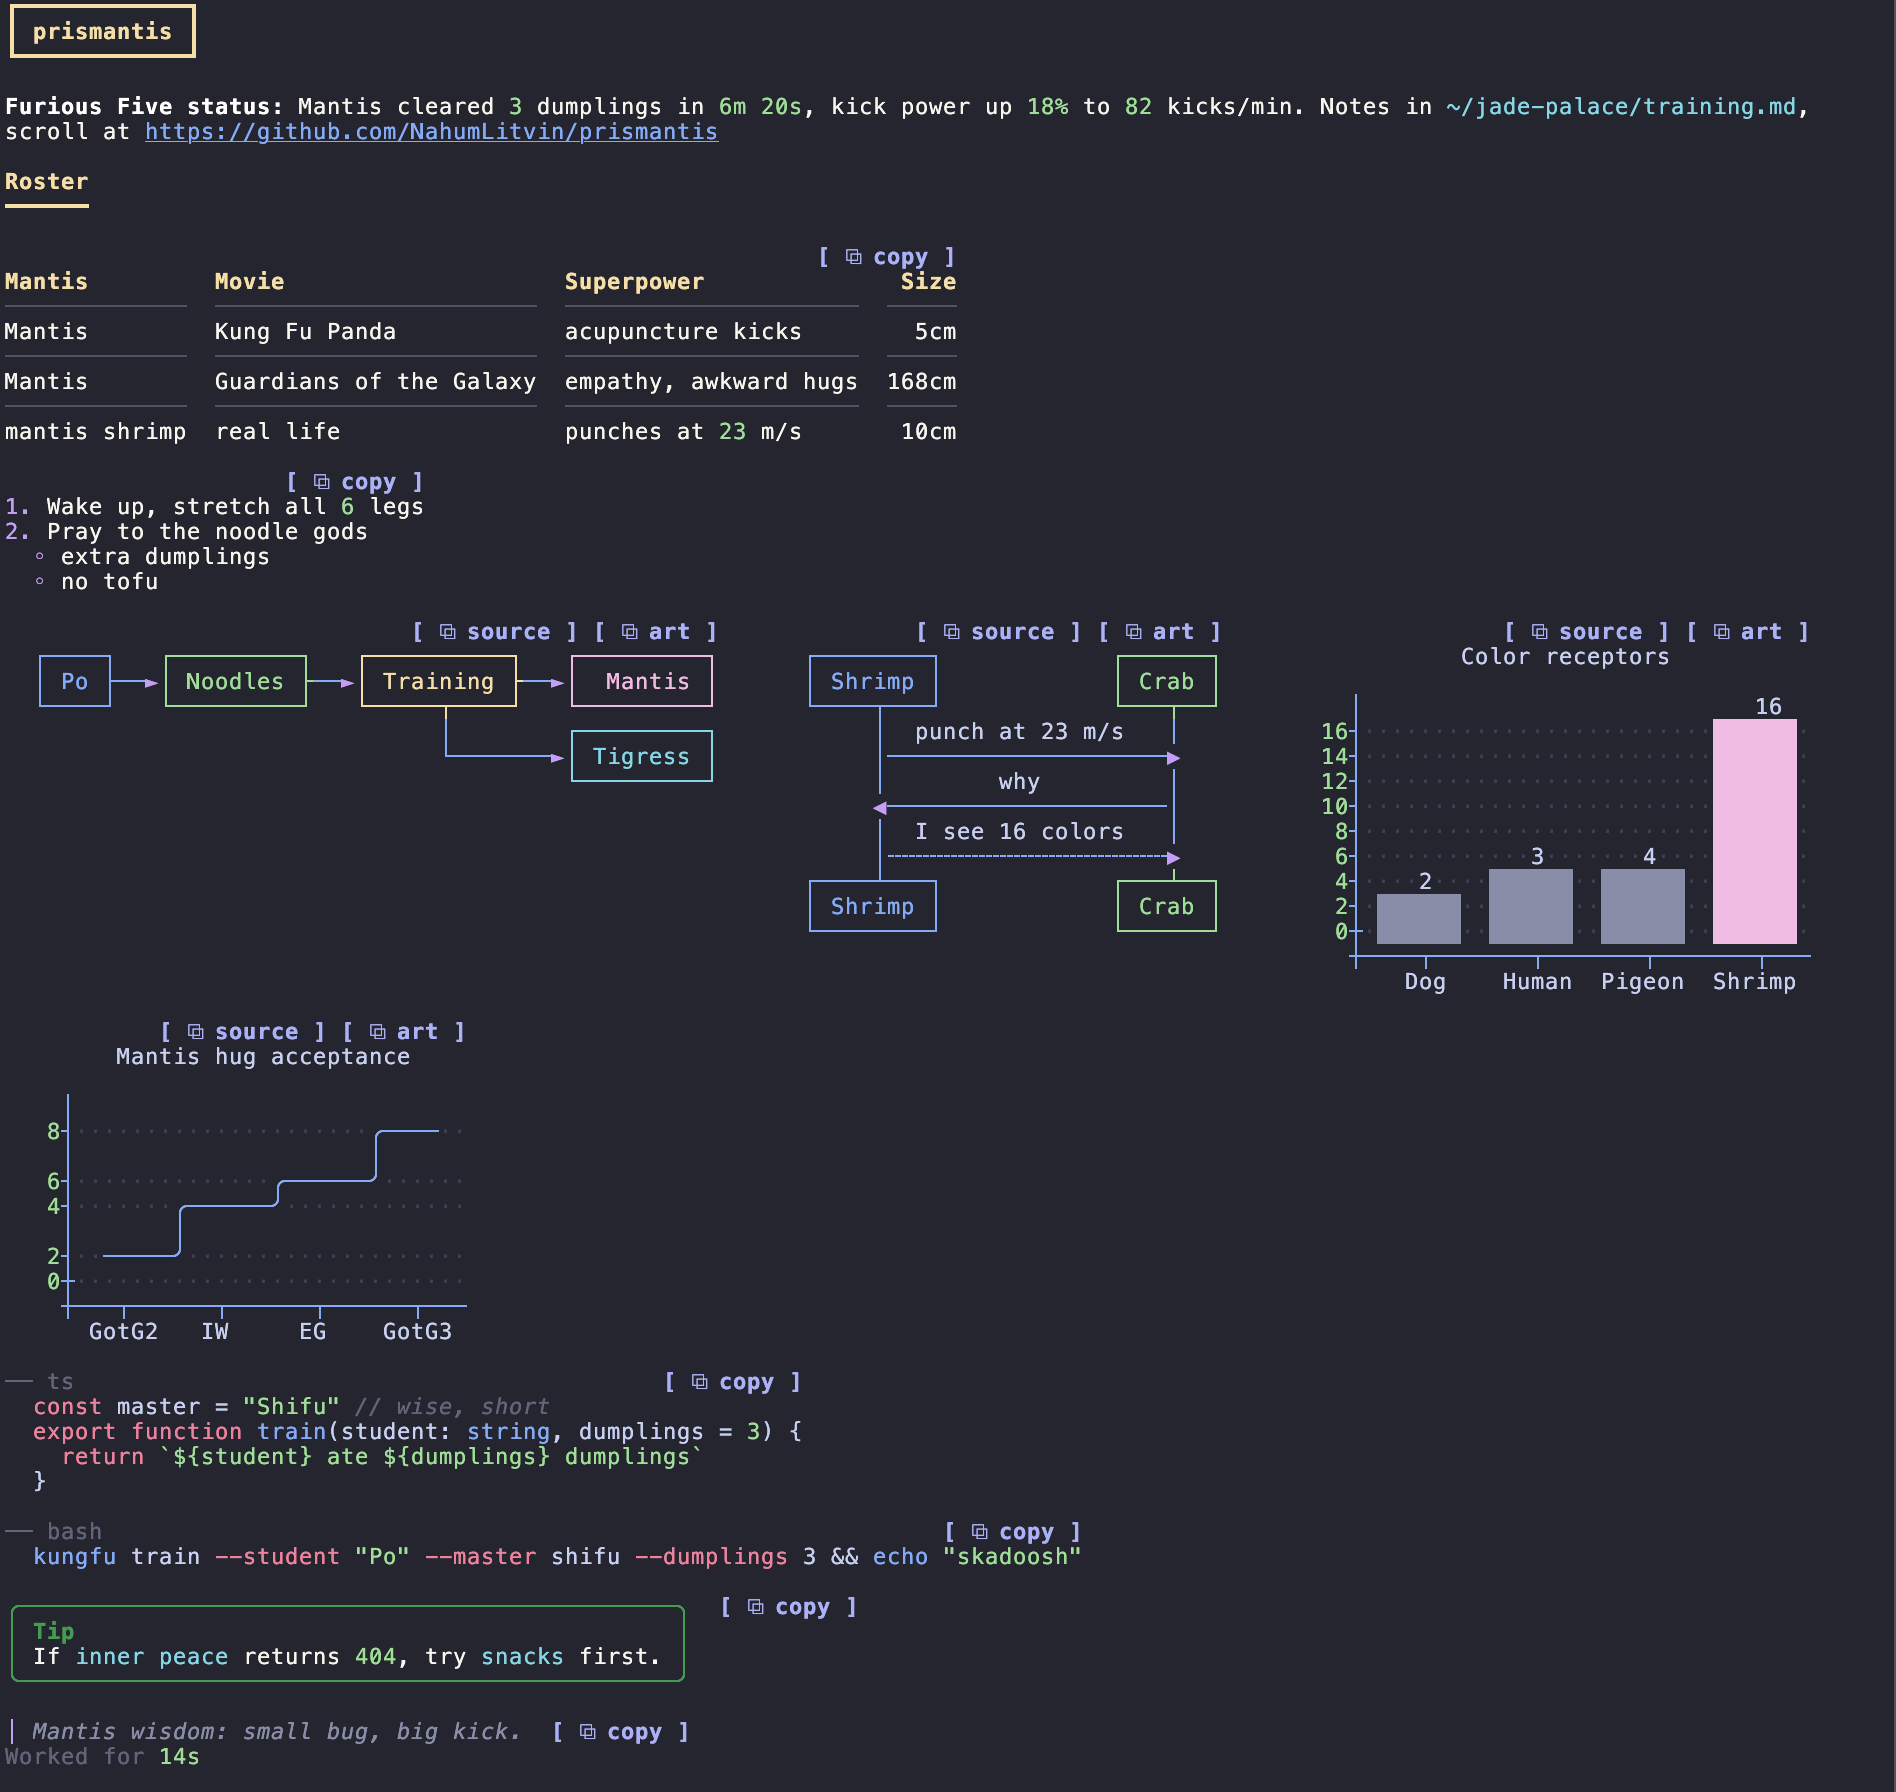
Colorful, themeable rendering for Claude Code replies: tables, headings, code, numbers, paths and links.
prismantis

# RemCTL 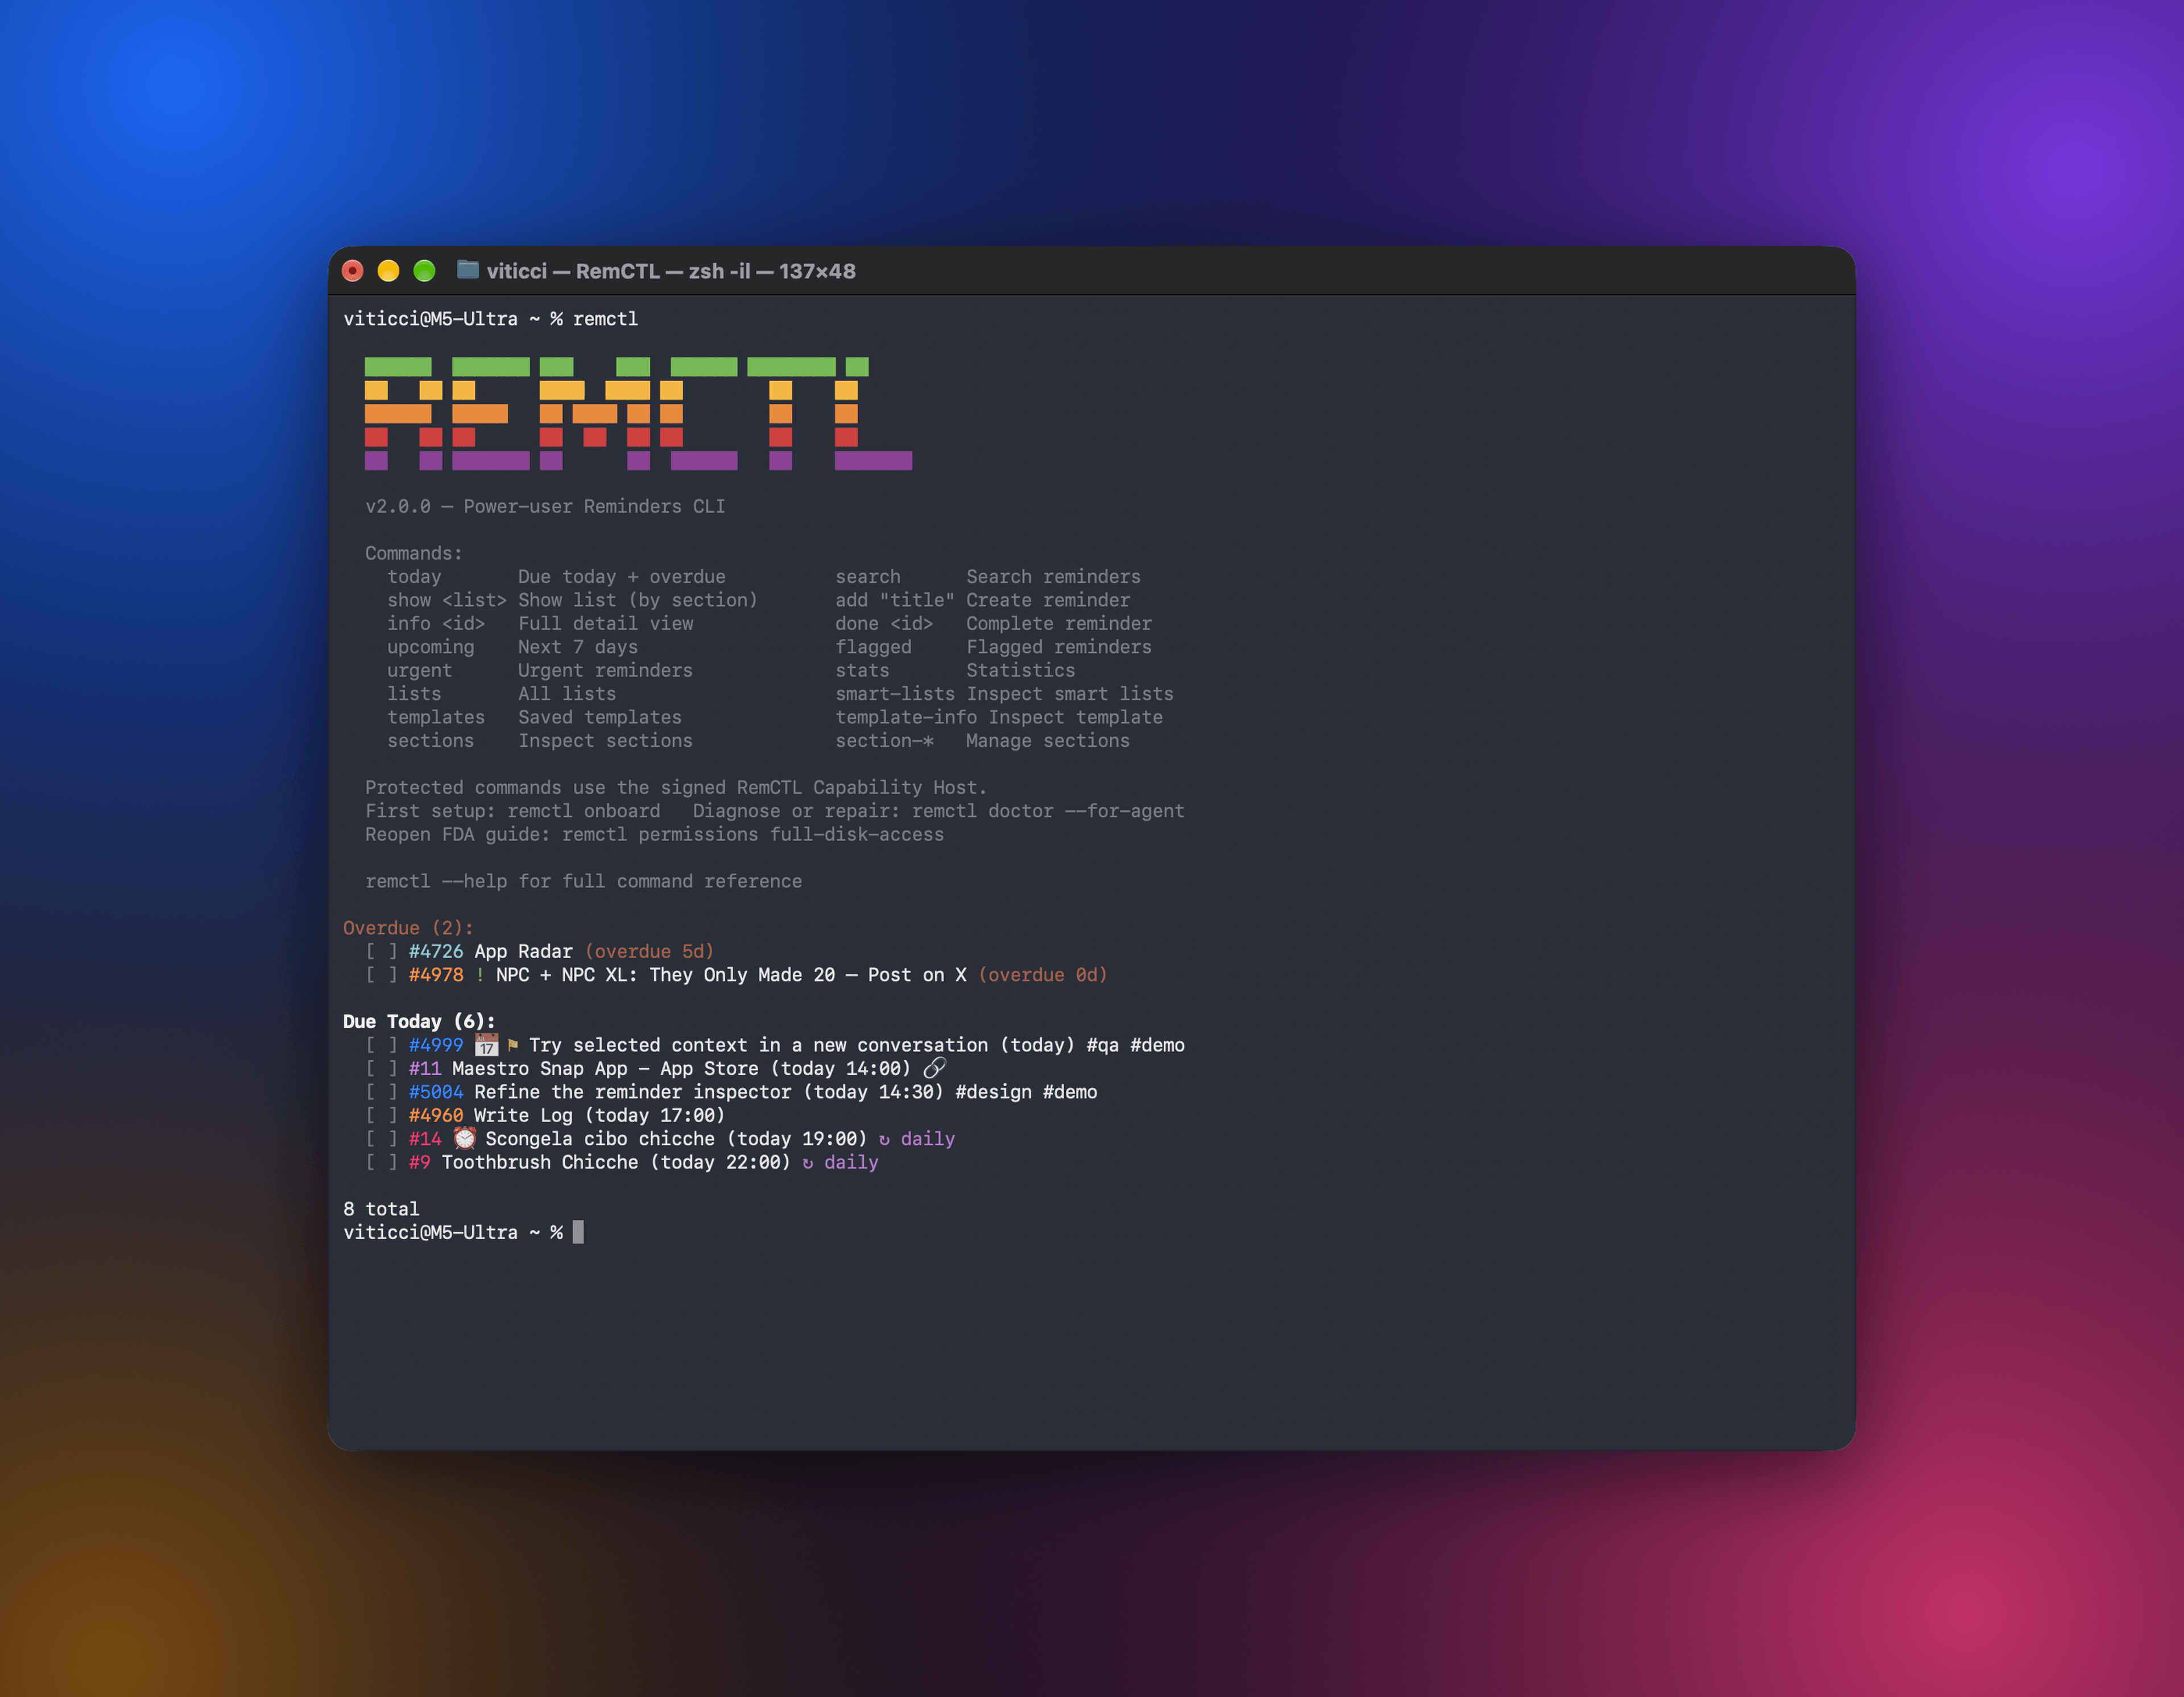 RemCTL gives you full control of Apple Reminders from the terminal, from AI apps, from a Reminders workspace inside Codex, and from a Today band in Claude Code. It covers the basics (reminders, lists, due dates, flags, and search) as well as features Apple doesn't expose to other apps, such as sections, tags, subtasks, smart lists, and templates.
