anthropics@anthropics
公式の Claude Code プラグインで、トランスクリプト内にチャートを描画します。Claude がツール結果や表に対して呼び出せるチャートツールに加えて、Prometheus、Datadog、Grafana などのメトリクスサービスからの結果には自動で折れ線グラフを表示します。ターミナルではテキストチャートを、デスクトップ、モバイル、VS Code アプリでは SVG をレンダリングし、自動チャートを無効化したり特定の MCP サーバーをスキップしたりする設定があります。
easel は Claude Code のトランスクリプト内に 2 つの方法でチャートを描画します。Claude は、ツール結果または渡した表に対して mcp__easel__chart を呼び出すことでチャートを要求でき、x、y、by の列を指定します。呼び出しに実際の選択の余地が残っている場合、ツールは拒否し、見つけた列を一覧表示し、Claude が再度呼び出します。別の方法として、別の MCP ツールの結果の下に自動の折れ線グラフが表示されますが、その結果が Prometheus や Datadog などのメトリクスサービスからのもの、または自身を時系列として宣言する Grafana フレームからのものである場合に限られます。形式には line(時間経過に沿った最大 8 系列)、columns(期間ごとに積み上げ)、sparks(最大 40 個の名前の横に小さな帯)、bars(名前ごとに 1 本)、share(全体の部分を 1 本のバーで表示)があります。ターミナルにはテキストセルが渡され、デスクトップ、モバイル、VS Code アプリにはペインと同じ幅の SVG が渡されます。アプリが接続されていないヘッドレスセッションでは、ツールもチャートも得られません。/config による設定:autoCharts は自動チャートをオフにし、autoChartSkip は自動チャートを決して取得しない MCP サーバーを指定します。このプラグインは推測せず拒否します。曖昧な日付、ロケール形式の数値、通貨の隣にある裸の数値は理由を明示して拒否され、行は数えられず、時刻はバケット化されません。入力は 64 KiB 未満、200 列、262,144 セル、JSON のネストは最大 32 階層に制限されます。テレメトリはデータテキストを送信せず、自身で綴った語に加えて系列数、点数、読み取り時間のみを送信し、読み取り時間は 2 の累乗に切り捨てられます。claude --plugin-dir mods/easel で試せます。テストは claude plugin test mods/easel で実行します。
まず作者の README で marketplace とプラグイン名を確認してください。コマンドはリポジトリの構成によって変わる場合があります。
claude plugin marketplace add anthropics/claude-code
claude plugin install easel@claude-code-plugins
Draws charts in the transcript of Claude Code. There are two ways to get one:
mcp__easel__chart on a tool result it already has, or on a table it passes itself, and names the columns (x, y, by). Where the call leaves a real choice open, the tool refuses, lists the columns it found, and Claude calls again.METRIC_FORMATS), or frames of Grafana's that say they are time series, with no unread value and no second table that may hold a number or a time. Such an answer says itself what is time, value and label. Any other table may hold numbers that measure nothing, such as an id or a postcode, so Claude has to ask.| form | what it shows | axis |
| --- | --- | --- |
| line | up to 8 series | time |
| columns | one column per period, stacked where the values add up | time |
| sparks | a small strip beside each of up to 40 names | time |
| bars | one bar per name | category |
| share | the parts of a whole as one bar | category |
A call that names a form over time for an x that holds only names is drawn as bars, and a note says so: no other form fits. That takes a bar for each name. Past the count of bars they would be ranked and cut, so the call is refused.
A terminal gets text cells. The desktop, mobile and VS Code apps get an SVG as wide as their pane. A headless session that no app has joined gets no tool and no chart, though its system prompt has the hint, which an app joining later must not change. A loop whose conversation the host does not keep, such as the one that suggests the next prompt, is refused a chart, and the call is not counted.
Settings (/config): autoCharts turns automatic charts off. autoChartSkip names MCP servers that never get one.
text ─ readData ─▶ Data, or a refusal
Data ─ chartOf ─▶ Chart ─ sceneOf(columns) ─▶ Scene ─ rasterOf ─▶ terminal rows
                                                    └ svgOf ───▶ SVG
readData returns can be drawn, so no later stage has an error path.chartOf makes all words and positions before any width is known. The painters get text and places, never data, so the terminal, the image and the model's text cannot disagree.register.ts only saves work, but for one note, one race and one rewrite (see Known gaps).| folder | what it holds |
| --- | --- |
| hooks/register.ts, answered-calls/, meet-watcher/, record-use/, with-newest-chart/, shell/, view/ | the hooks; the four functions that they hand the host's $ to; the helpers that take what the hooks read; the element trees they return |
| core/easel/ | the two entry points, chartFromCall and chartFromResult |
| core/call/, forms/ | what the model reads about the tool; the forms and their limits |
| core/tables/, wire/, json/ | a text to tables; the metric formats |
| core/cells/, calendar/ | one cell to a number or a time; calendar steps and ticks |
| core/casting/, reading/, column-summary/ | the roles of a table's columns; tables to series, and every reason to refuse |
| core/refusal/, usage/ | the code of each refusal; what telemetry is told |
| core/charting/, numbers/ | series to words and positions |
| core/layout/, shapes/ | words and positions to shapes in cells |
| core/raster/, svg/ | the two painters |
| core/texts/, lists/ | text width and truncation; list helpers |
A hooks module may import only its own files and the types of claude-code, so texts/ and lists/ carry their own helpers. Each folder holds one declaration a file and is read through its index.ts, except where that would close an import cycle: two types that name each other share a file, and a file imports another folder's file directly instead of its index.ts.
METRIC_FORMATS (wire/). The first format whose paths all lead somewhere wins.INPUT_SCHEMA (call/); the type and the validator derive from it. Use it in reading/ if it changes what is read, else in chartOf.call/, a row in FORMS, READ_AS in casting/, formProblemIn in reading/, a member of Chart, and a case in sceneOf. A new shape fails to compile until both painters handle it.{ code, why }. A new code goes in REFUSAL_CODES (refusal/), and a case must get it. The event has room for 31. Past that, fold rare codes into one word there: a mark's reason has no such limit.No text of the data is sent: every word is one that the plugin spells itself (usage/). Three numbers depend on the data: how many series, how many points, and the time to read them and lay them out. Each is rounded down to a power of two. The host refuses any other entry, takes none from an installed copy, and sends nothing where analytics are off.
| what | when | says |
| --- | --- | --- |
| mark easel_chart | Claude asks | ok; sad data_left_out, where a note says that cells, tables or lines are not in the chart (series with no value, or over a form's limit, do not count); sad form_replaced, where bars were drawn for a form over time; bad with the refusal's code |
| mark easel_auto | nobody asks | ok; bad failed for a crash. A result that gives no chart is not marked: that is nearly every MCP result |
| event tengu_plugin_easel_chart | with each mark | the outcome, the form, whether the call named it and whether bars took its place, the format, where the data came from, the three numbers, the surfaces, and whether a subagent called |
| event tengu_plugin_easel_settings | somebody comes to watch | off or skips_servers, only where the user changed autoCharts or autoChartSkip. It can repeat in a session |
06/01/2026, 1.000,50 and a bare number beside $12,400 are refused, with the reason. Rows are not counted and times are not put in buckets.values by rows beside range, with the names in the first row.df -h) and tables with no header are likely, not certain. A result with a stray line, an unread cell or a second table that may hold numbers or times is charted in part, and a note says so.context as a system reminder, unescaped, so nothing from a result may go there.--ax-screen-reader included. Installed, it reads CLAUDE_AX_SCREEN_READER; when that variable is unset or not a yes/no value, it takes axScreenReader from the first of managed, --settings or user settings that has it, never from project or local settings. It can't tell when --setting-sources leaves user settings out, so it may then still draw charts as text.background: false where transcripts are not saved, whose charts no screen showed.excludeDynamicSections, or --system-prompt) never has it, and a thread recorded without it does not gain it on a resume./mcp or blocked by a policy, an agent without it), every resume waits the whole 500 ms.--continue a chart call's header row can be missing until a resize. A plugin is handed the newest 4,096 messages, so an older chart call has no chart after a resume, and an older row has none on an app. On an app, a row whose transcript read fails has no chart until the pane is resized.data can read the result before it: it is refused, or draws an older table that has the same columns, and a redraw then shows another chart. Built in and in the main conversation, it waits: it reads the transcript again until that holds an answer of every other tool's call made before it in the turn (answeredCalls). After 5 waits, 310 ms in all, it takes the transcript as it is, since some calls are listed and never answered. An installed copy does not wait. The race can also hide the answer of a call that gives no table: after [query, another tool] in its batch, a chart call that does not wait draws the query's result, until a redraw, and one that waits is refused.data reads: the last in the order of the calls that is not empty, not failed and not a chart's. After a batch of queries, a call that names the columns of an earlier one is refused. Where the query before it failed, it draws the last result that did not.psql, YYYYMMDD dates, two header lines (vmstat), the envelopes of Snowflake and Databricks, and the compact rows of ClickHouse.isReadAtInstants), as Prometheus does. No host stores when another tool answered, so a redraw that the cache no longer serves, as after a restart, draws the same lines without that note.claude --plugin-dir mods/easel
then ask Claude for a chart of a table, or of a tool's result.
claude plugin test mods/easel
tests/register.test.ts covers the three ways a result ends: a chart call draws, the answer of a metrics service gets an automatic chart, and any other answer gets none.
あなたのプロジェクトですか?このバッジを README やサイトに貼ると、このページにリンクします。

Threads の投稿がオープンソースプロジェクト oil-oil/oil-ui を紹介している。Claude Code、Codex などの AI Agent がさまざまな UI デザインの方向性を探索し、並べて比較し、実際のスクリーンショットに基づいて反復修正するために使うデザイン Skill を売りにしている。投稿には GitHub リンク、スター数、ライセンス情報のみが添えられており、インストール手順やデモ素材は提供されていない。

Claude Code の統合ステータスライン。複数 CLI(Claude、Codex、Gemini、Antigravity、z.ai)の使用量、コンテキスト、レート制限、コストを監視します。
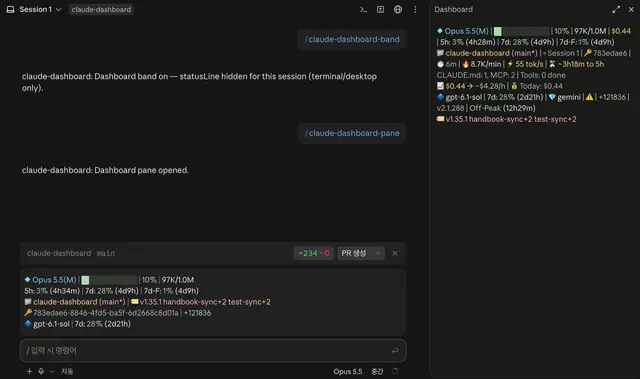

プロンプトの上、ステータス行、トーストに未読 AMP メッセージを表示し、アイドル状態の Claude Code セッションを起こして読ませます。Claude Code 2.1.287 以降が必要です。
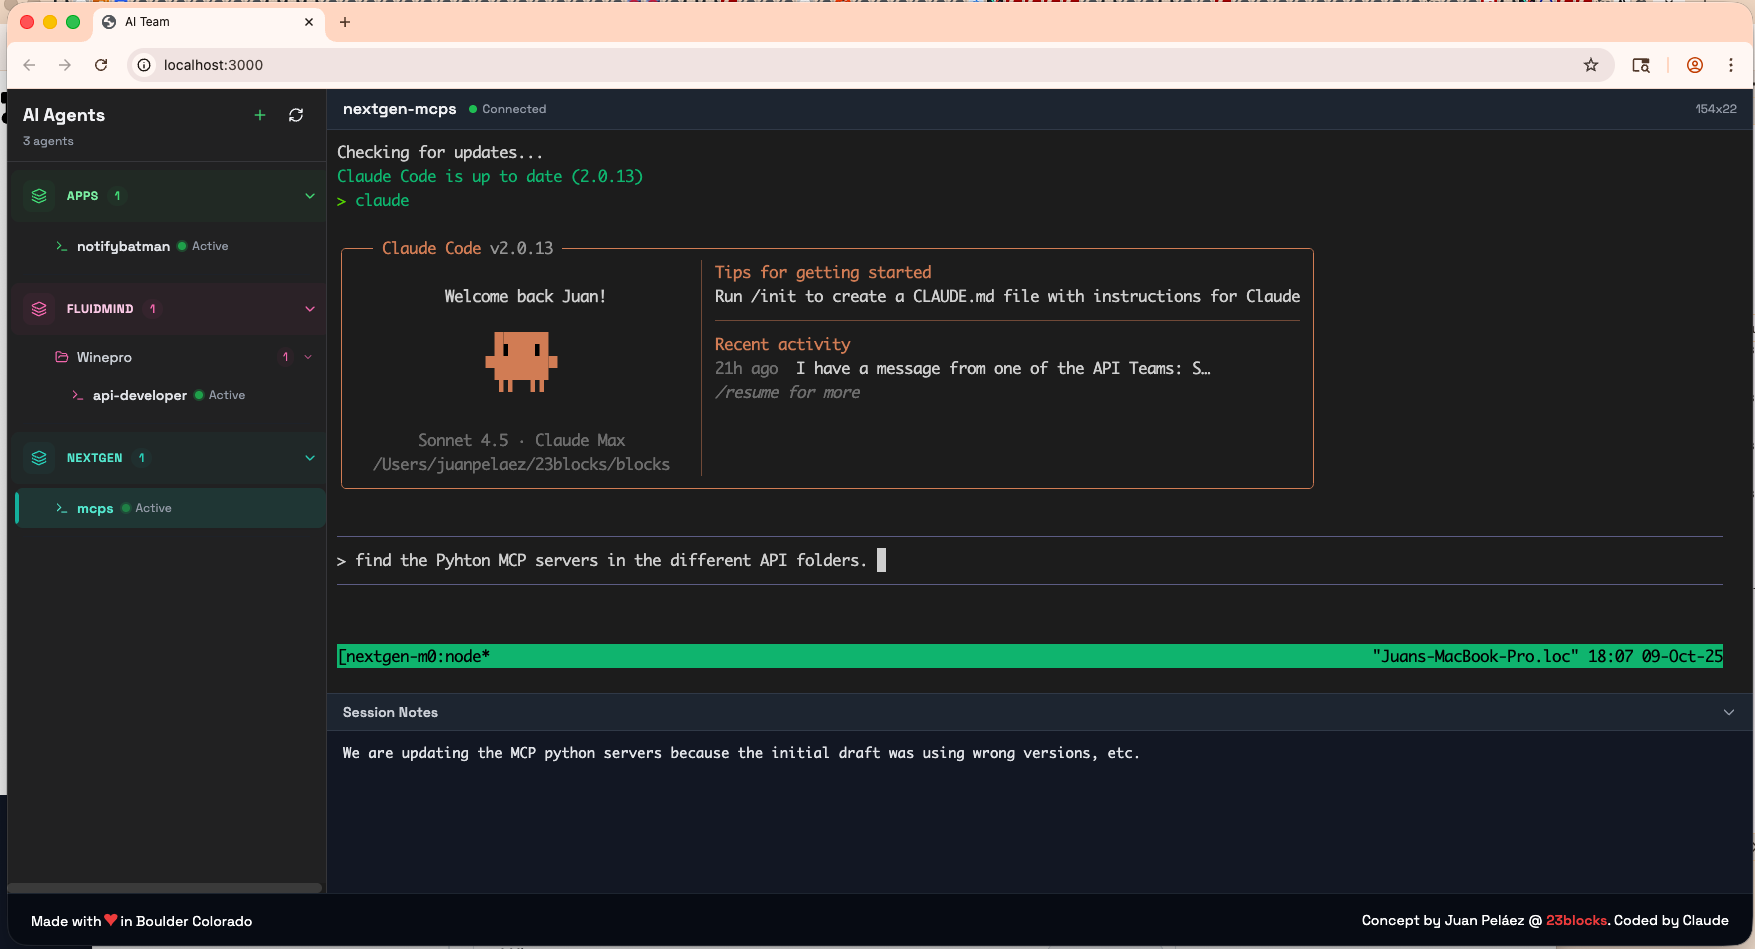

rayfin CLI に追従するペインとして説明されている、data-goblin/power-bi-agentic-development Claude Code プラグイン marketplace の Fabric Data App プラグイン。

ステータスラインの下に表示されるプロンプトキャッシュの行:ウォーム時は残り分数、コールド時は次のメッセージで再キャッシュされるトークン数。/cache-clock setup で追加できます。

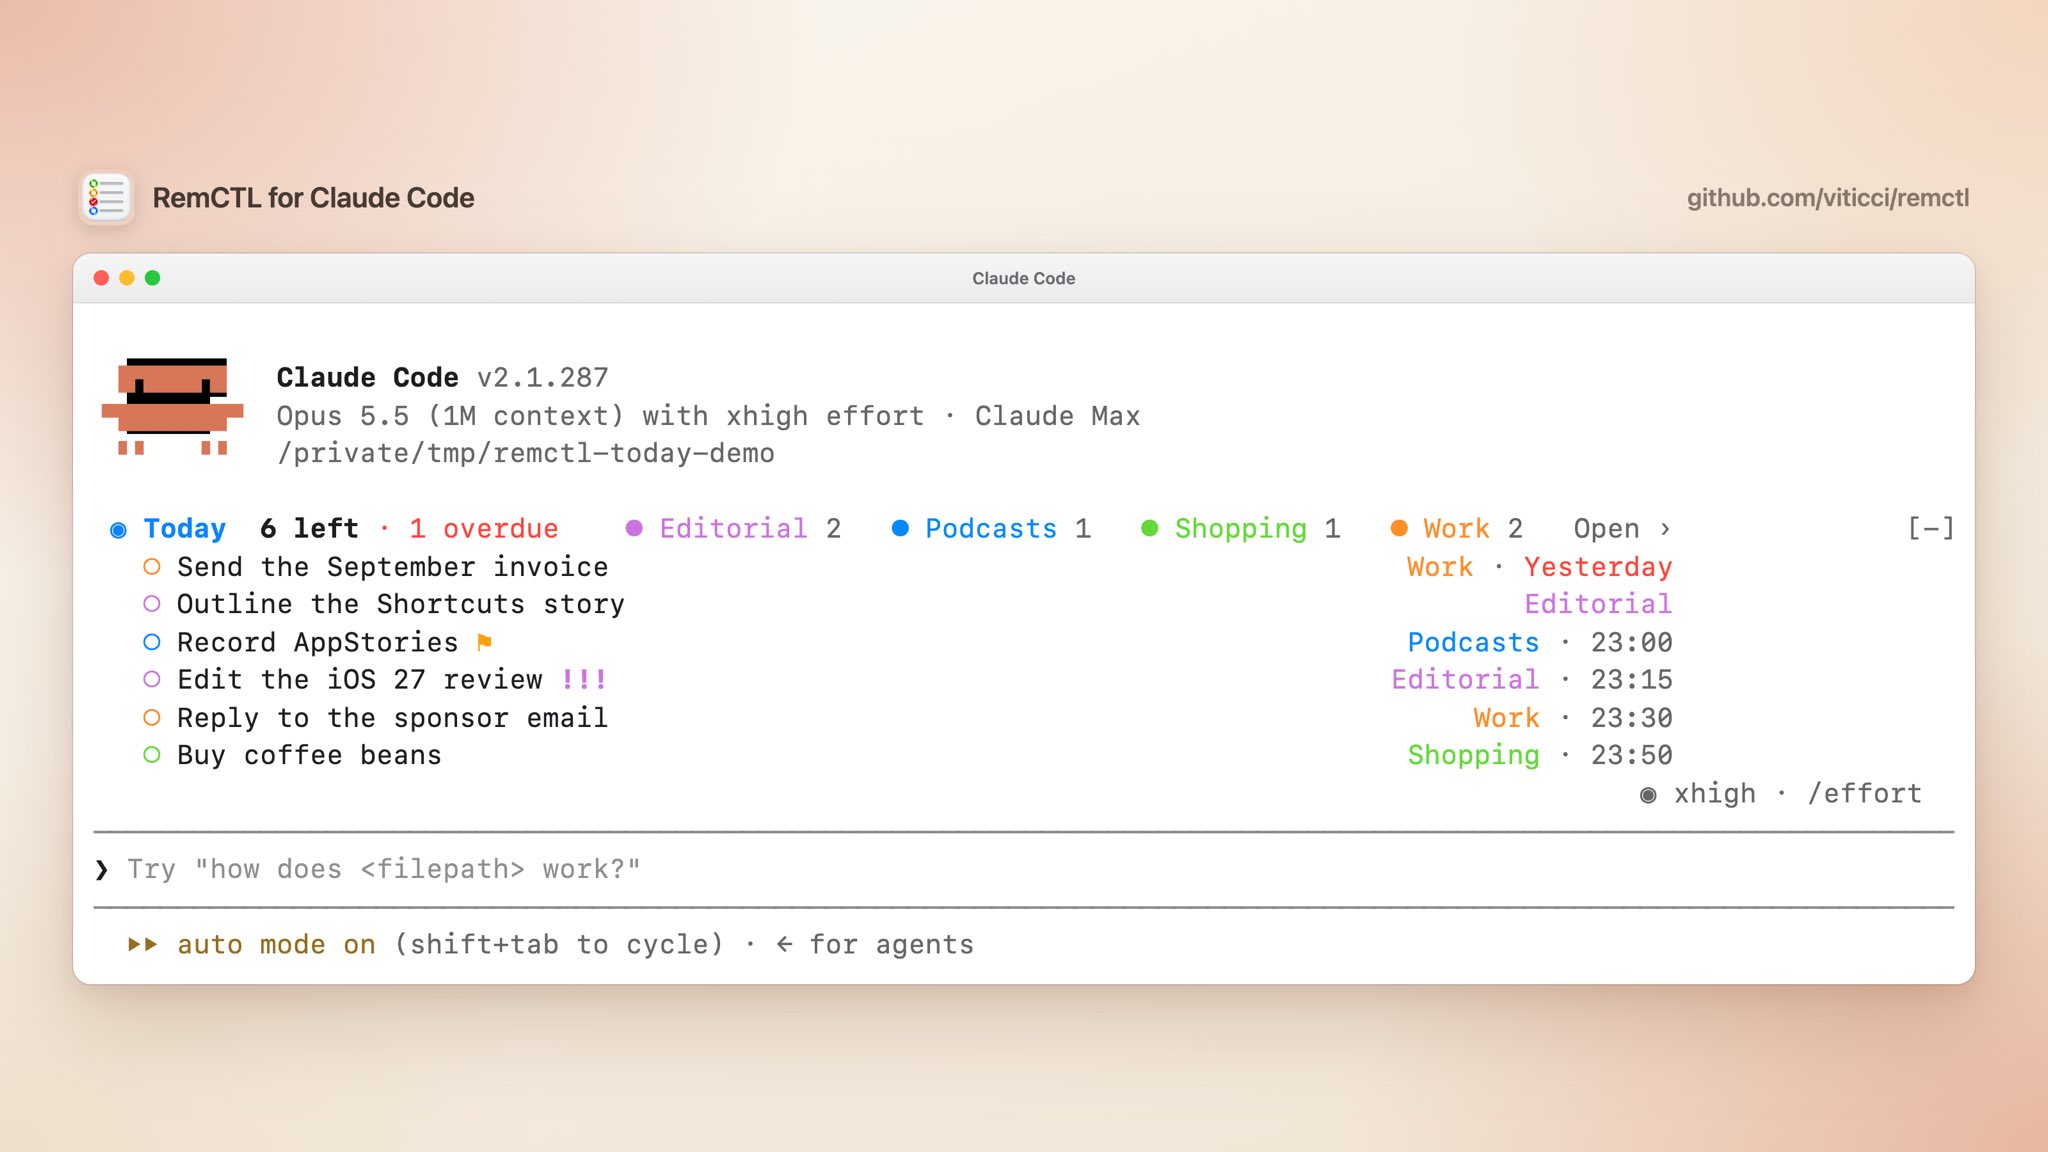
Claude Code で Apple Reminders を取得しましょう。 RemCTL 2.1.0 には Claude Code プラグインと mod が同梱されるようになったので、今日残っているタスクや特定のリストの内容をいつでも確認できます。サイドバーまであります! アップデートはこちらから:https://github.com/viticci/remctl @amorriscode