helenkwok@helenkwok
helenkwok/gsd-status-mod
面向 GSD 專案的 Claude Code mod:提供路線圖、含分支的代理樹、成本與上下文、工作流、工作階段日誌、速度與適配度預測、時間線、趨勢、Markdown 閱讀器、狀態橫幅、下一步提示與 /gsd-status,資料來自 .planning/。
helenkwok/gsd-status-mod
gsd-status-mod 是 GSD 專案的唯讀即時儀表板。它從 .planning/ 讀取目前階段路線圖、含分支與子代理的代理樹、即時計時、上下文與成本、工作流,以及內建 Markdown 閱讀器。不需相依套件,不會在 GSD 專案之外繪製內容。
請先查看作者 README,確認 marketplace 與外掛名稱;指令可能隨儲存庫結構而變動。
claude plugin marketplace add helenkwok/gsd-status-mod
claude plugin install gsd-status-mod
A live dashboard for GSD projects, as a Claude Code mod: the roadmap with the current phase
marked, an agent tree with forks and sub-agents and live clocks, context and cost, work streams, and a built-in markdown
reader for .planning. Read-only, no dependencies, and it draws nothing outside a GSD project.
Install (Claude Code 2.1.287 or later):
claude plugin marketplace add helenkwok/gsd-status-mod
claude plugin install gsd-status-mod@helenkwok-mods
It is a Claude Code mod. It adds a live pane and four smaller things, each showing what the GSD statusline does not:
GSD · stopped: PAUSED 2026-09-09 after the schema review · 9/14 phases  ⚠ ~124 commits since STATE.md   <- above the prompt
❯ /gsd-execute-phase 2                                                                                          <- dim suggestion, Tab to take
⏵⏵ auto mode on (shift+tab to cycle) · next: Run /gsd-execute-phase 2 · handoff 5d ago                          <- end of the line under the prompt
GSD · line (above the prompt): shown only for a GSD project (a .planning/STATE.md whose frontmatter has
gsd_state_version). stopped_at cut to its first sentence, plus phases done. It never repeats status or the plan
counts, which the GSD statusline already shows, and it shows no age: STATE.md's last_updated is touched without the
content changing.
⚠ ~N commits since STATE.md: on that line, when the commit in state_head is 5 or more commits behind this
clone's HEAD, so you know STATE.md is stale. Counted from the git reflog, so approximate (it undercounts: 124 against
217 from git rev-list on one repo); hidden when state_head is absent or not in the reflog.
next: hint (end of the line under the prompt): next_action from .planning/HANDOFF.json, with the handoff's
own age. It is added as a dim tail, so the engine's line and its pills stay, and it is hidden while you type or while a
turn runs. GSD deletes the file after a resume, so it goes away when it is no longer needed.
Tab suggestion (the empty prompt box, once at session start): only when the text shown in the next: hint names a
command. It offers that command, plus a phase number or version if one follows (/gsd-execute-phase 2), so it always
matches the hint beside it. Prose-only actions (Nothing is pending) and actions that say to go elsewhere (Open a session in ~/other-project and run ...) get no suggestion. Tab only fills the box; nothing runs until you press Enter.
The engine proposes its own suggestion after each turn, so ours shows at session start only.
/gsd-status command: the full resume report on demand, read fresh from disk, with no terminal-height limit.
Phase and status, phase and plan progress, the whole stopped_at, the drift warning, and from HANDOFF.json the
next action and its command, blockers, human_actions_pending ("Needs a person"), remaining tasks and how many files
were uncommitted at pause. In a project that is not GSD it says so.
Live pane (docked on the right of a wide terminal, 144+ columns; /gsd-board opens or closes it, and the
openOnStart option turns the auto-open off). Bordered boxes that update as events happen, not only per turn:
ROADMAP.md with the current phase marked. The current phase comes from
STATE.md (its current_phase, or the label that starts current_phase_name); it is never guessed, so a project
whose state names no phase shows the list with no marker. Only - [x] **Phase N: name** lines are read.wave: in the phase's *-PLAN.md frontmatter; a plan with a NN-MM-SUMMARY.md is done.
p shows the wave-by-wave list, this phase's time by stage, and the time by type.
History: each finished agent leaves one small record, kept in the plugin's own store across sessions (the last 300
per project): type, phase, duration, number of model responses, token counts and model. No description, no prompt, no
text. With five or more past runs of a kind, a running agent's clock shows typ 0:20 beside it, in amber once it is
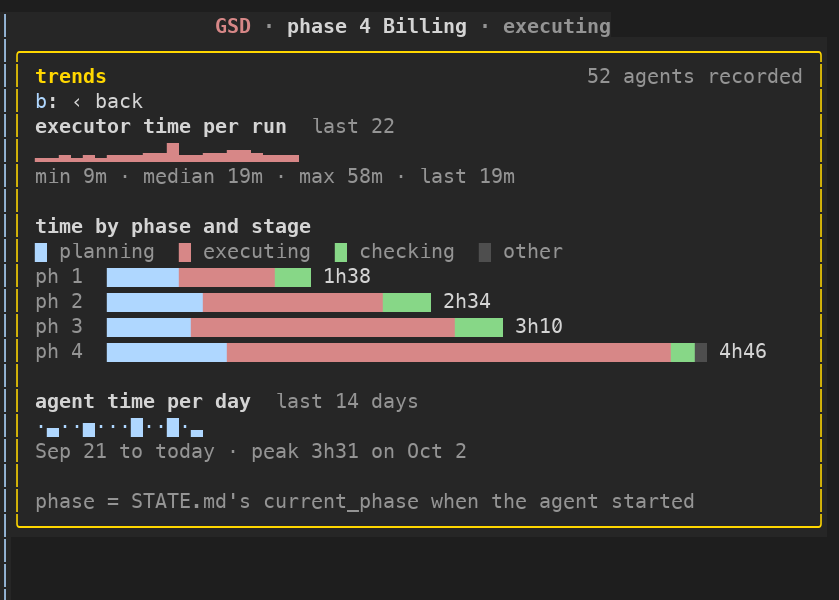
over twice the typical. t: ▸ trends opens three charts: executor time per run (a sparkline of the last 30), time by
phase split into planning, executing and checking, and agent time per day for 14 days, each with its numbers beside it.
History starts from the day you update; it is per project and never read from transcripts.
Fit: with three or more past executor runs, a left line says how long the phase's open waves should take (one
typical executor run per wave, so plans that can run together count once), the 5h line gives the window and when it
resets, and the quota line adds how far the rest of the phase should take the window. Quota is measured, not guessed:
while executors run, the plugin notes how far the 5-hour window rose and divides it by how many ran together, so a
single executor and a wave of three both give a per-executor figure. It needs five such measurements, shows a range
(the middle half of them), and leaves out any stretch with a reviewer or planner in it or where the window reset. The
account is shared with the main conversation and other sessions, so read it as a range. When the next wave runs plans
together, a next line shows what that wave alone should add.
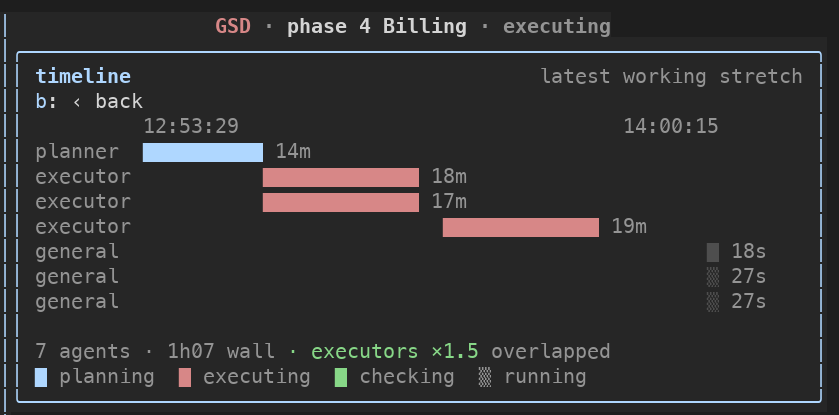
g: ▸ timeline draws one bar per agent over the latest working stretch (until a gap of 30 minutes, at most 12 agents,
running ones shaded): agents that ran together sit on top of each other and agents that ran one after another form a
staircase, with the executors' parallelism underneath.⑂) and sub-agents under their parent, and a live
clock. Finished agents fold away while others run.o: ▸ read .planning (or any entry under work streams) swaps the dashboard for a browser of
.planning, one folder at a time (so any depth), and then for the file itself, drawn by Claude Code's own Markdown
element: the same typography as a reply, at the pane's width, scrolled with the wheel or PageDown/End. The YAML
header is hidden, - [x] shows as ✓ and - [ ] as ○, and a relative link to another .md file under .planning
opens it. A path opens only if its real location, symlinks followed, is still under .planning's own, so a symlink inside
.planning cannot lead the reader elsewhere. b goes back one level, and d: ⌂ dashboard returns to the dashboard from any depth, and t: ↑ back to top ends every file. Only .planning is readable.
A file with three or more headings gets c: ▸ contents: a list of its headings (up to 30, levels 1 to 3) that jumps
to one. In a fullscreen terminal, a Read, Write or Edit of a .planning markdown file also gets a line under its tool
row in the transcript, open in the GSD reader, that opens the pane on that file.Everything with a ▸ is clickable. With the pane focused (ctrl+x, then Tab) hotkeys work too: 1-6 agent rows,
b blockers, r roadmap, p pace, t trends, g timeline, w workstream, o read .planning, c contents (in a file), f finished agents, l log. The pane is read-only. The cost is whatever Claude Code
reports for the session, shown as is; it is an estimate, not a bill. The band above the prompt is hidden while the
pane is open, so the same line is not drawn twice.
Workstream mode. When .planning/STATE.md is missing but .planning/workstreams/<name>/STATE.md exists, the pane reads
that workstream's STATE.md, ROADMAP.md and work streams, plus the project-wide folders left at .planning/ (threads, spikes, seeds...), merged into the same counts (and its HANDOFF.json, else the top-level one). GSD's own
choice of active workstream is per session and a mod cannot see it, so the plugin uses the name in
.planning/active-workstream if there is one, else the workstream whose STATE.md changed most recently. With more than
one, a w: ⇄ workstream … button (click, or w) switches to the next. The workstream name shows in the header.
Everything follows a .planning symlink and draws nothing when there is nothing to show. The band and hint refresh at
session start and after each turn; the pane also refreshes on tool calls and agent events.
Toasts (the toasts option, on by default): short notices, each said once: an agent that has run more than twice its
typical time, the rest of the phase getting tight against the 5-hour window (about 90% or more by the end, or the work
outlasting the window when quota is not measured yet), and drift appearing between STATE.md and the commits.
The band does not show plan usage (5-hour / weekly limits), since quota-meter and limit-watch already do; the pane's
main box does show them, for the one-glance view.
The eight below are from a made-up demo project (acme-portal). The five pane images are the pane's own output from a live
Claude Code session with three background agents and a seeded made-up history, drawn to PNG from the terminal text (cropped to the pane); the three
band images are from a terminal at least 16 rows tall.
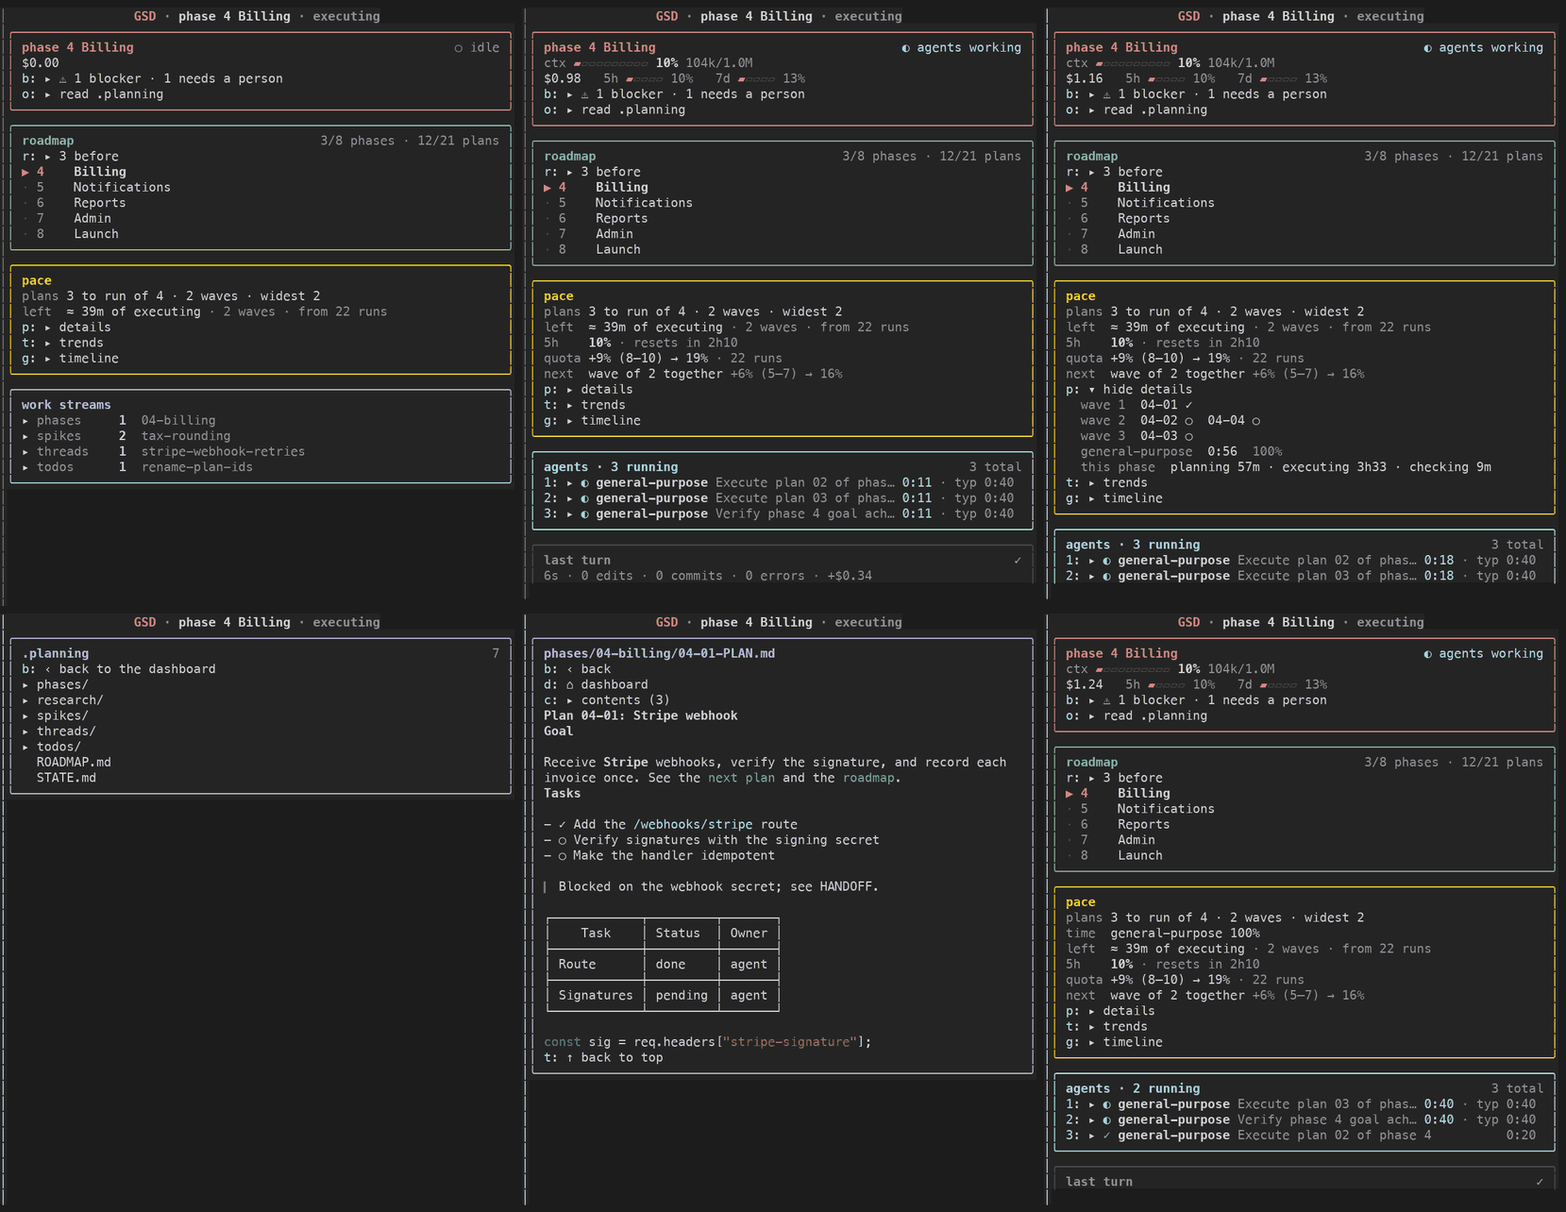
The pane. From the top: the main box (context, cost, limits, blockers), the roadmap with the current phase marked, the
pace box (the plans left and their waves, how long the rest should take and how far it should take the 5-hour window, and
what the next wave of parallel plans adds), the agents with a typical time beside each running clock (typ 0:40, from past
runs), the last turn, and the work streams. The history behind the pace box (22 executor runs, with quota measured on them) is
made up for the demo, and the 5h and 7d figures are the demo session's own.
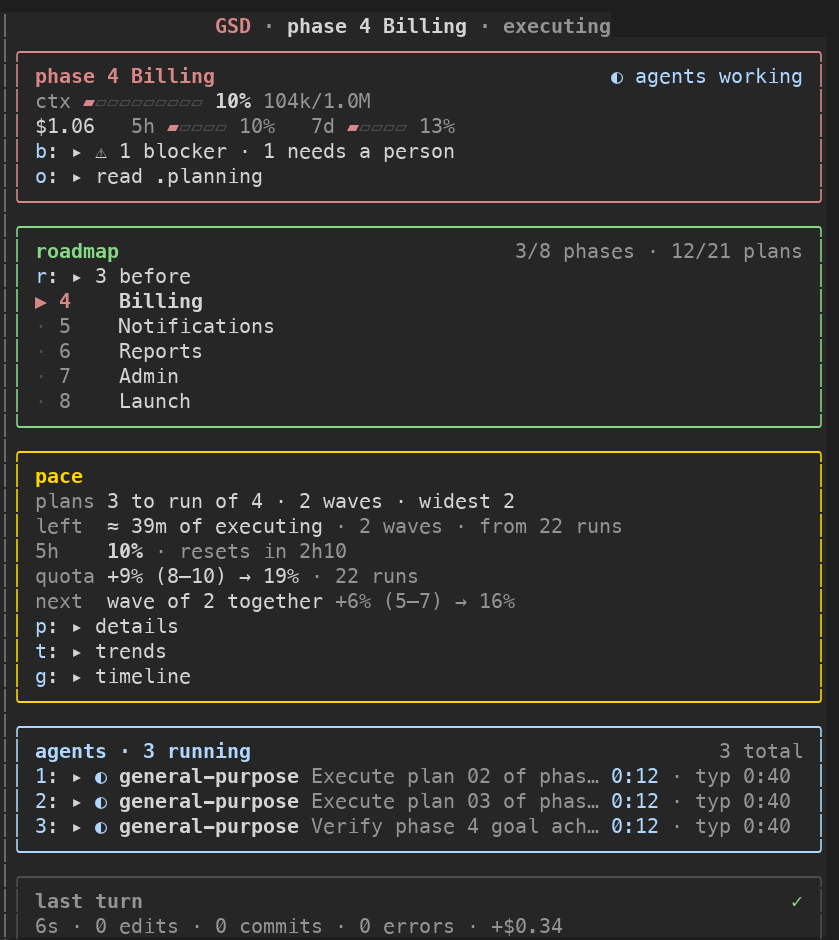
The pane with the pace details opened. Pressing p opened the wave-by-wave plan list, the time by agent type, and this
phase's time by stage. The other ▸ rows open the same way, by click or key.
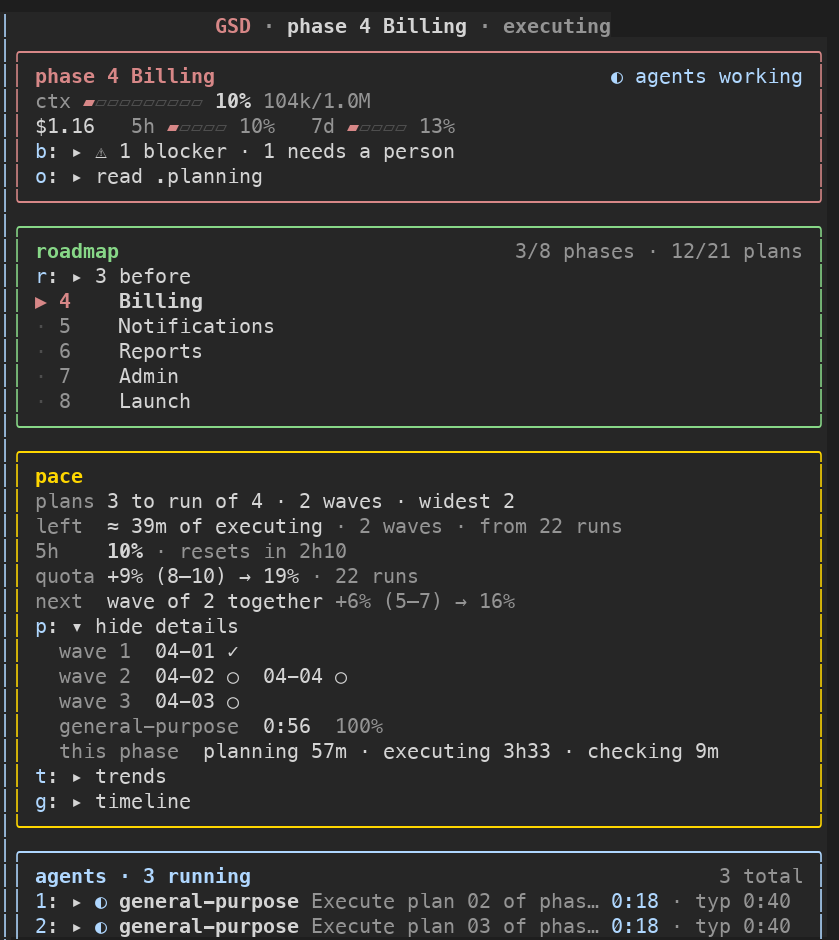
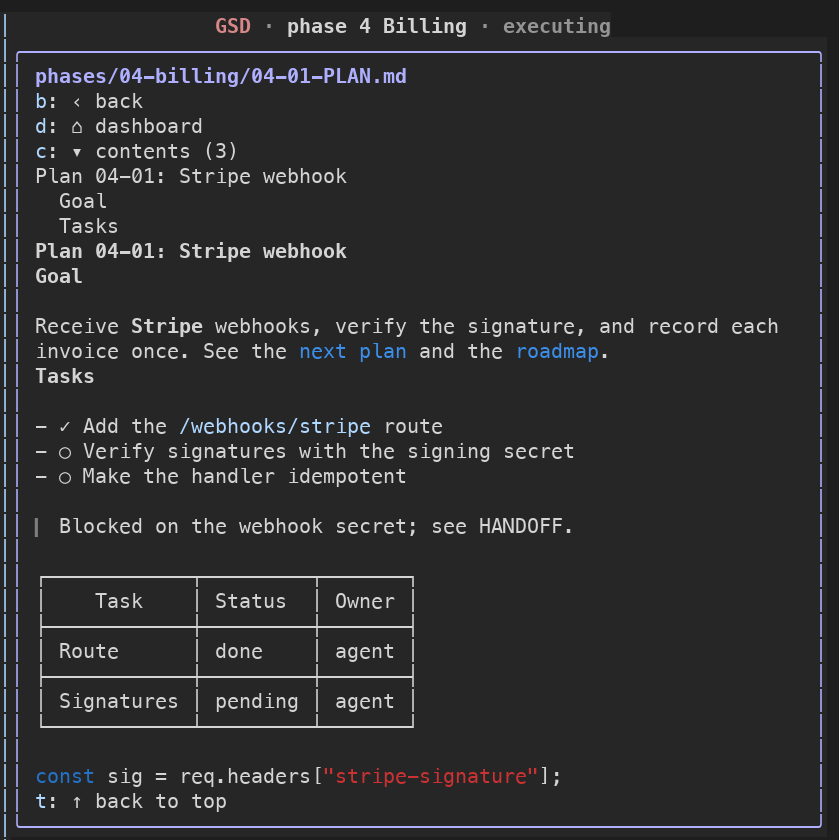
The markdown reader. A phase plan opened from o: ▸ read .planning: the YAML header is hidden, tasks show as ✓ and ○,
and the two blue links are relative links that open the next plan and the roadmap in the same pane. c: ▾ contents lists the
headings; a click jumps to one.
The trends view. Opened with t: ▸ trends. The numbers behind it are made up for the demo (38 agents over four phases),
since a fresh demo project has no history: executor time per run, time by phase split into planning, executing and
checking, and agent time per day.
The timeline. Opened with g: ▸ timeline: one bar per agent over the latest working stretch, coloured by stage. The two
executors that ran together sit on top of each other, the third waited for them, and the three short bars at the right are
agents still running or just done. The runs are made up for the demo.
The band, in the three images below. The ◐ medium · /effort
row, the Sonnet 5.5 │ v1.0 · paused │ acme-portal statusline and the auto mode on text are Claude Code's and the
GSD statusline's own; what this plugin adds is the cyan and yellow line above the prompt, the dim text in the prompt
box, and · next: … · handoff 2d ago at the end of the last row.
A handoff that names a command. The GSD · line, the drift warning (~8 commits since STATE.md), the dim
suggestion in the prompt box (Tab to take it), and the same command in the next: hint beside it.

A handoff that names no command. The hint still shows the next action, but no suggestion is made, so the prompt box keeps
Claude Code's own Try "…" text.

Not a GSD project. A .planning/STATE.md without gsd_state_version is ignored: nothing is added.

Read-only, and nothing leaves the machine:
$.fs.read, $.fs.list, $.fs.stat): any .md under .planning/ the reader opens (only when you click it), and .planning/STATE.md, ROADMAP.md, HANDOFF.json, the entry names in .planning/phases,
spikes, threads and the other work-stream folders, and the git reflog (.git/logs/HEAD, or the worktree's git dir
named in a .git file). Paths resolve from the session root ($.session.root), not the current folder, so a Bash
cd does not lose the project. In a linked git worktree with no .planning of its own, .planning is read from the
main checkout.$.session.usage (context, cost, limits), $.agent.list (the live agents), $.store (the history above, in the plugin's own store) and $.clock.now /
$.clock.every (a 1-second redraw timer, active only while something runs and the pane is open).$.ui.open, $.ui.close, $.ui.invalidate and $.ui.resolve for the pane and band, $.command.register for
/gsd-status and /gsd-board, and $.prompt.suggest (a dim suggestion in the empty prompt box: it cannot send anything).session.start, turn.start, turn.step, turn.complete, tool.call and agent.spawn (to count edits and
errors, count an agent's responses and record how long it ran, and note forks; it never changes or blocks a call), command.run, ui.render and ui.close.It writes no files, runs no processes and makes no network calls. Check it
yourself: claude plugin validate .claude-plugin/plugin.json prints the hooks and the $ calls the module makes.
Tested on Claude Code 2.1.288 with quota-meter and limit-watch loaded together with this plugin: all three load
without errors and each draws in its own place (they use the pinned status line and a pane; this uses the AbovePrompt
band).
The AbovePrompt band and the hint line are shared. This plugin keeps whatever other mods draw there: it draws what is
below it in the chain and puts its line on top, and it appends its hint tail after another mod's tail. A mod that answers without calling next hides every mod after it in load order; if
such a mod loads before this one, its band is the only one shown, and that is the other mod's behaviour.
claude plugin marketplace add helenkwok/gsd-status-mod
claude plugin install gsd-status-mod@helenkwok-mods
After that it loads in every session, with no flag. In a project that is not a GSD project it draws nothing. Update with
claude plugin update gsd-status-mod@helenkwok-mods; remove with claude plugin uninstall gsd-status-mod@helenkwok-mods.
Add --scope project to install it for one project only.
Needs Claude Code 2.1.287 or later (claude --version) and Node 20+ only if you want to run the tests. There is nothing to
build or install: the plugin is loaded from its folder for one session.
git clone https://github.com/helenkwok/gsd-status-mod ~/gsd-status-mod
cd <a GSD project>        # it reads .planning from the folder you start claude in (or its main checkout, in a worktree)
claude --plugin-dir ~/gsd-status-mod
To check the plugin itself: cd ~/gsd-status-mod, then claude plugin validate . (the marketplace file),
claude plugin validate .claude-plugin/plugin.json (the hooks and $ calls) and node --test tests/*.test.mjs.
The band above the prompt is not drawn in a very short terminal window: it appeared at 16 rows and above and not at 13 (the engine drops it). The hint tail and the suggestion are unaffected.
On Windows the pane has been used in a workstream project (it showed the roadmap and workstream); the other features have not been tried there. A session in a worktree shows the main checkout's .planning, which is wrong if that worktree is on a different phase. Background:
open-gsd/gsd-core#5174 (a maintainer asked to revisit in-tree support in November 2026; this plugin is the out-of-tree route).

文件產生、漂移偵測與 API 文件自動化外掛程式,同時作為 function-hook 防護,拒絕含有機密的文件寫入或 worker 派送。

一個 Claude Code 外掛 mod,提供 /databricks-pane:依照 databricks CLI,以樹狀結構呈現 Databricks 工作區、Unity Catalog、計算資源、工作、管線、應用程式和儀表板,並支援即時醒目顯示、設定檔切換和複製 CLI 參數。

Claude Code 模組,會在提示列上方以縮圖預覽貼上的圖片,不只顯示 `[Image #n]` 標籤。